Canadian mining assets
Source: Government of Canada
The Global Presence of Canadian Mining Companies
Canadian mining assetsFootnote 1 (CMA) totaled $256.9 billion in 2014, a 7.7% increase from the revised 2013 value of $238.5 billion. Canadian mining assets abroad (CMAA) totaled $169.7 billion, up 7.5% from the revised 2013 value of $157.9 billion. CMAA as a percentage of CMA remained stable at 66% for both years.
Movement of the exchange rate continued to have a notable impact on CMA values. The value of the U.S. dollar rose from C$1.064 at the end of 2013 to C$1.153 at the end 2014, an 8.4% increase.Footnote 2 As a result, the value of CMA held by firms reporting in U.S. dollars also increased in most cases.
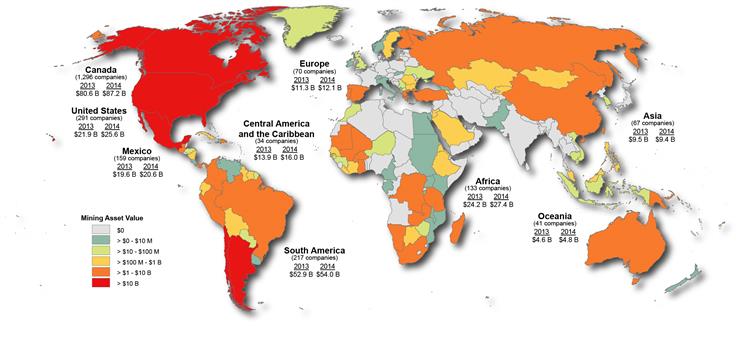
Canadian mining and exploration companies were present in 105 foreign countries in 2014. The majority of CMAA (68%) was in the Western Hemisphere (the Americas). Table 1 displays the amount and percentage of CMAA by region and Figure 3 provides more regional details on a map. Almost every region experienced growth in 2014 with the exception of Asia. A regional overview, highlighting notable changes and contributing events, is provided below.
Africa is the region that experienced the greatest amount of growth in percentage terms (13.3%) in 2014. The most notable changes were located in:
- Zambia (+$1.2 billion): First Quantum Minerals continued to develop the Sentinel copper mine and to expand the Kansanshi mine, which is the largest copper mine in Africa. These investments were partly offset by an impairment recorded by Barrick Gold at its Lumwana copper mine.
- Madagascar (+0.6 billion): Sherritt International owns a 40% stake in, and is the operator of, the Ambatovy nickel-cobalt project, which achieved commercial production in early 2014. SNC-Lavalin also held a 5% stake in this project that was divested in 2015.
In Latin America, the overall value grew by 4.8% to $90.5 billion, which accounted for 53% of CMAA. Four of the top five countries (Chile, Mexico, Argentina, Peru, and the Dominican Republic) contributed to the gains, while Argentina experienced notable losses:
- Argentina (-$2.3 billion): Additions in 2013 related to Goldcorp’s development of the Cerro Negro gold project were more than offset by an impairment recorded by the company in 2014.
- Peru (+$2.1 billion): Hudbay continued to develop the Constancia copper-gold-molybdenum mine and Rio Alto acquired the Shahuindo gold project.
- Chile (+$1.7 billion): Lundin Mining acquired 80% ownership in the Candelaria copper-gold-silver mining complex, which was partially offset by an impairment recorded by Barrick Gold at its Cerro Casale gold-copper project.
- Panama (+$1.3 billion): First Quantum Minerals continued to develop the Cobre Panama copper mine.
In Asia, overall CMAA remained steady again in 2014, although some fluctuations occurred at the country level. In China (+$0.6 billion), China Gold International Resources was investing to expand its Jiama copper-gold mine, whereas B2Gold recorded an impairment at its Masbate gold mine in the Philippines (-$0.5 billion).
Europe experienced another year of growth, although it was more modest than in recent years. The additions arose largely from investment by Eldorado Gold in Greece (+$0.6 billion) in two development projects: the Olympias gold-silver-lead-zinc mine and the Skouries gold-copper mine.
The CMAA value in Oceania remained stable.
The value of CMA held by junior companies Footnote 3 declined 1.8% in 2014. Junior companies accounted for almost 90% of the total company count and for 8% of the total CMA value in 2014. About half of their assets by value were located in Canada with another 35% located elsewhere in the Americas.
Senior companiesFootnote 3 held a smaller portion of their assets by value in Canada (33%), but also held a large portion of their assets in the rest of the Americas (46%). In 2014, the overall CMA value of senior companies increased by 8.7%. The top 10 companies by value for 2014 accounted for nearly two-thirds of total CMA and for over 80% of the net year-over-year increase with a cumulative value of $166.0 billion.
Annual variations
In comparing asset totals across years, it is important to understand the causes of variations. Additions mostly arise from mining asset development and construction. Subtractions arise from asset write-offs, impairments, depreciation, sales, and mine closures. Exchange rate movements, changes of accounting methods, mergers and acquisitions, and the relocation of company headquarters also contribute to annual variations.
For 2014, a total of 1,694 companies were identified as being headquartered in Canada and potentially having mineral assets in Canada or abroad:
- 1,573 were identified as possessing mining assets;
- 26 (2%) had mining assets with a value in excess of $1 billion;
- 174 (10%) had operating revenues;
- 799 (50%) had interests outside of Canada; and
- 586 (37%) had mining assets in at least two countries.
Uuse of CMAA statistics
When the question is asked “What is the value of Canadian mining investment in Country X?,” some care is required in answering. CMAA, as tracked by Natural Resources Canada, differ from Canadian Direct Investment Abroad (CDIA) figures estimated by Statistics Canada. CDIA is based on Foreign Direct Investment (FDI) as defined internationally, based on national systems of accounts. CMAA are based on financial accounting standards applied by Canadian public companies and auditors. Table 2 outlines the principal differences between these approaches.
Footnotes
Footnote 1
Values are those reported in financial reports, for the accounting period nearest to December 31, 2013, for public companies headquartered in Canada that are not under foreign control. Mining assets, in this context, reflect non-current assets, including mineral properties, deferred mineral exploration expenses, and royalties, investments in non-Canadian mining companies and other non-current assets related to mining that can be reconciled to a geographic location.
Footnote 2
Bank of Canada, average December noon rate converted into Canadian dollars.
Footnote 3
Junior companies, for the purpose of this bulletin, are companies without operating revenues originating from mineral production or other business segments. All other companies are considered to be senior companies.